

Understanding the Language of Meta Ads Manager
For many Indian entrepreneurs and small business owners, opening the Meta Ads Manager can feel like walking into a cockpit of a commercial airplane. There are buttons everywhere, flashing numbers, and terms like CPM, ROAS, and Attribution Windows. However, learning how to read meta ads is not just a technical skill; it is a vital business necessity in today digital landscape. Whether you are running a boutique in Jaipur or a tech startup in Bangalore, your ability to interpret these numbers determines whether you are investing your money or simply burning it.
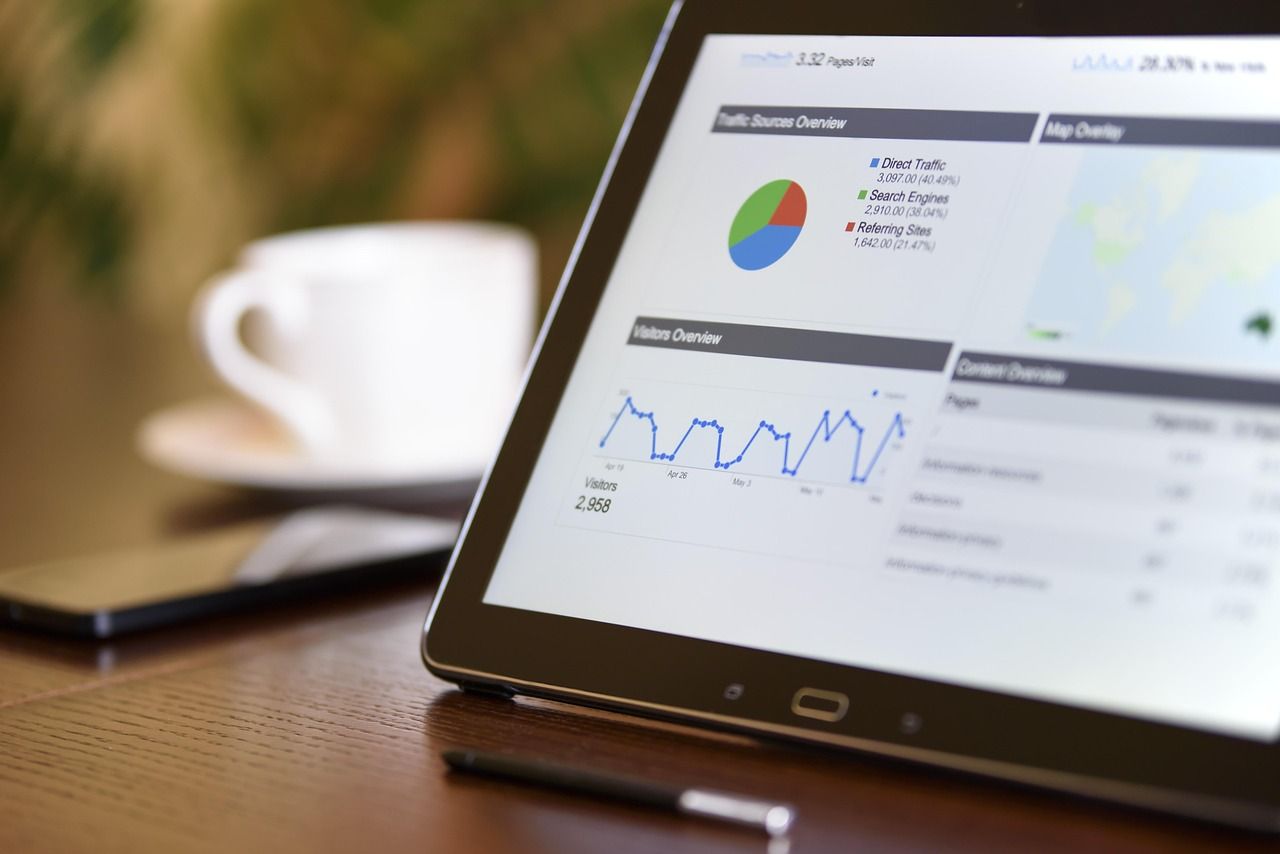
Meta ads, which include advertising on Facebook and Instagram, operate on a data-heavy infrastructure. The platform provides a wealth of information, but the challenge lies in filtering the noise to find the signals that actually impact your bottom line. This guide will walk you through the essential metrics and strategies to understand your dashboard like a pro.
The Three-Tier Structure of Meta Ads
Before diving into the specific numbers, you must understand how Meta organizes your data. This hierarchy is the foundation of how you read your results.
1. The Campaign Level
This is where you set your objective. Are you looking for brand awareness, website traffic, or sales? When you look at the Campaign tab, you are looking at the big picture. If your objective is Sales but you see a high number of Reach and very few purchases, your campaign level data is telling you that while people are seeing your ad, they are not taking the intended action.
2. The Ad Set Level
The Ad Set level is all about targeting and placement. Here, you can see how different audiences are performing. For example, you might find that your audience in Delhi is clicking more frequently than your audience in Mumbai. Reading data at this level helps you decide where to allocate more of your budget.
3. The Ad Level
This is the creative level. Here, you see which specific image, video, or copy is resonating with your audience. If you have three different videos running, the Ad level data will tell you which one has the highest engagement. This is crucial for understanding the aesthetic preferences of your Indian customers.
Key Metrics You Must Monitor
To master how to read meta ads, you need to familiarize yourself with these primary metrics. Let us break them down into simple terms.
CPM (Cost per 1,000 Impressions)
CPM tells you how much you are paying to show your ad to 1,000 people. In the Indian market, CPMs can vary wildly based on the time of year. During the Diwali or Holi season, competition increases, which usually drives CPMs up. If your CPM is unusually high, it might mean your audience is too narrow or the market is currently very competitive.
CTR (Click-Through Rate)
This is the percentage of people who clicked your ad after seeing it. A high CTR generally means your creative is attractive and relevant to the audience. In India, a CTR above 1 percent is often considered a healthy benchmark for e-commerce, though this varies by industry. If your CTR is low, it is a sign that your ad image or headline is not catching the eye of the scroll-happy Instagram user.
CPC (Cost per Click)
CPC is the average cost you pay for each click on your ad. For Indian businesses, keeping an eye on CPC is vital for managing a daily budget. If you are spending 500 Rupees a day and your CPC is 50 Rupees, you are only getting 10 visitors to your site. You need to analyze whether those 10 visitors are worth the 500 Rupees spent.
ROAS (Return on Ad Spend)
This is the holy grail of metrics for any business selling products online. ROAS tells you how many Rupees you earned for every Rupee spent on ads. If you spent 1,000 Rupees on ads and generated 4,000 Rupees in sales, your ROAS is 4.0. Reading this metric helps you understand the direct profitability of your marketing efforts.
The Difference Between Clicks and Landing Page Views
One of the biggest mistakes Indian advertisers make is confusing Link Clicks with Landing Page Views. When you read your Meta Ads report, you might see 500 Link Clicks but only 200 Landing Page Views. Why the discrepancy? In India, mobile internet speeds can be inconsistent. Many people click an ad by mistake or click it and then close the browser because the website takes too long to load. If the gap between clicks and views is too large, your website speed is likely hurting your conversions.
How to Customize Your Dashboard
The default view in Meta Ads Manager is rarely the most helpful. To read your ads effectively, you should customize your columns. Click on the Columns dropdown menu and select Customize Columns. Ensure you add the following to your view:
- Frequency: This shows how many times the average person has seen your ad. If this number goes above 3 or 4, your audience might be getting bored, leading to ad fatigue.
- Amount Spent: Always keep track of your daily and total spend in INR.
- Results: This should align with your campaign objective (e.g., Purchases or Leads).
- Cost per Result: This tells you the efficiency of your spending.
Interpreting the Learning Phase
When you launch a new ad or make a significant change, Meta puts your ad set into a Learning Phase. During this time, the platform is experimenting to see who is most likely to click or buy. Many beginners see fluctuating numbers during this phase and panic, turning off the ads too early. When reading your ads, look at the Delivery column. If it says Learning, wait until the platform has gathered enough data (usually around 50 conversions) before you make any major decisions.
Analyzing Performance by Demographics
India is a diverse country with different behaviors across states and age groups. To truly understand how to read meta ads, use the Breakdown feature. You can break down your results by:
- Age and Gender: Are older men in Chennai buying your product, or is it younger women in Delhi?
- Platform: Is Instagram performing better than Facebook? Often, lifestyle brands find more success on Instagram, while service-based businesses find value on Facebook.
- Region: This allows you to see which Indian states are giving you the best return. You might find that you are wasting money in states where you do not have efficient shipping or local relevance.
Making Data-Driven Decisions
Reading the data is only the first step; the second step is acting on it. Here is how to troubleshoot common scenarios based on the numbers you see:
- Scenario A: High CTR but no sales. This means your ad is great, but your website or product pricing is discouraging people from buying. Check your checkout process or offer a limited-time discount code for Indian shoppers.
- Scenario B: High CPM but high ROAS. This means you are paying a lot to reach people, but the people you are reaching are very high-quality customers. Do not be afraid of high costs if the profit is there.
- Scenario C: Low CTR and low Reach. Your ad is likely being penalized by Meta for low quality, or your audience is too small. Try broadening your targeting or refreshing your creative content.
Conclusion
Mastering how to read meta ads is a journey of constant learning. The digital marketplace in India is evolving rapidly, and what worked six months ago might not work today. By focusing on the metrics that matter, such as ROAS and Landing Page Views, and by understanding the nuances of the Indian consumer, you can turn the Ads Manager from a confusing dashboard into a powerful engine for growth. Remember to be patient with the data, test different creatives, and always keep your business goals at the center of your analysis.
How do I know if my Meta Ad is performing well?
Performance depends on your goal. If you are selling a product, your Return on Ad Spend (ROAS) is the best indicator. If you are looking for brand awareness, watch your Cost Per 1,000 Impressions (CPM) and Reach. Generally, if your Cost per Result is lower than your profit margin, your ad is performing well.
What is a good CTR for Meta Ads in India?
While it varies by industry, a Click-Through Rate (CTR) of 1% is a common benchmark for the Indian market. Higher competition industries like fashion or electronics might see higher CTRs, while niche B2B services might see lower ones. Focus on improving your CTR by testing better images and headlines.
Why is my Cost per Click (CPC) increasing?
CPCs usually increase due to high competition, such as during the festive season in India, or because of ad fatigue. If the same audience sees your ad too many times, they stop clicking, which drives up the cost. Try refreshing your ad creative or expanding your target audience.
Should I focus more on Facebook or Instagram for Indian audiences?
The best way to decide is to use the Breakdown feature in your Ads Manager. Generally, younger audiences in tier 1 and tier 2 cities are more active on Instagram, while Facebook still holds a massive user base across all age groups and regions in India. Let the data from your initial campaigns guide your future placement strategy.


